Get your FREE pitch deck review!
Automate your monthly/quarterly reports
Wouldn't it be great if your monthly/quarterly reports would just update themselves?
They now can!
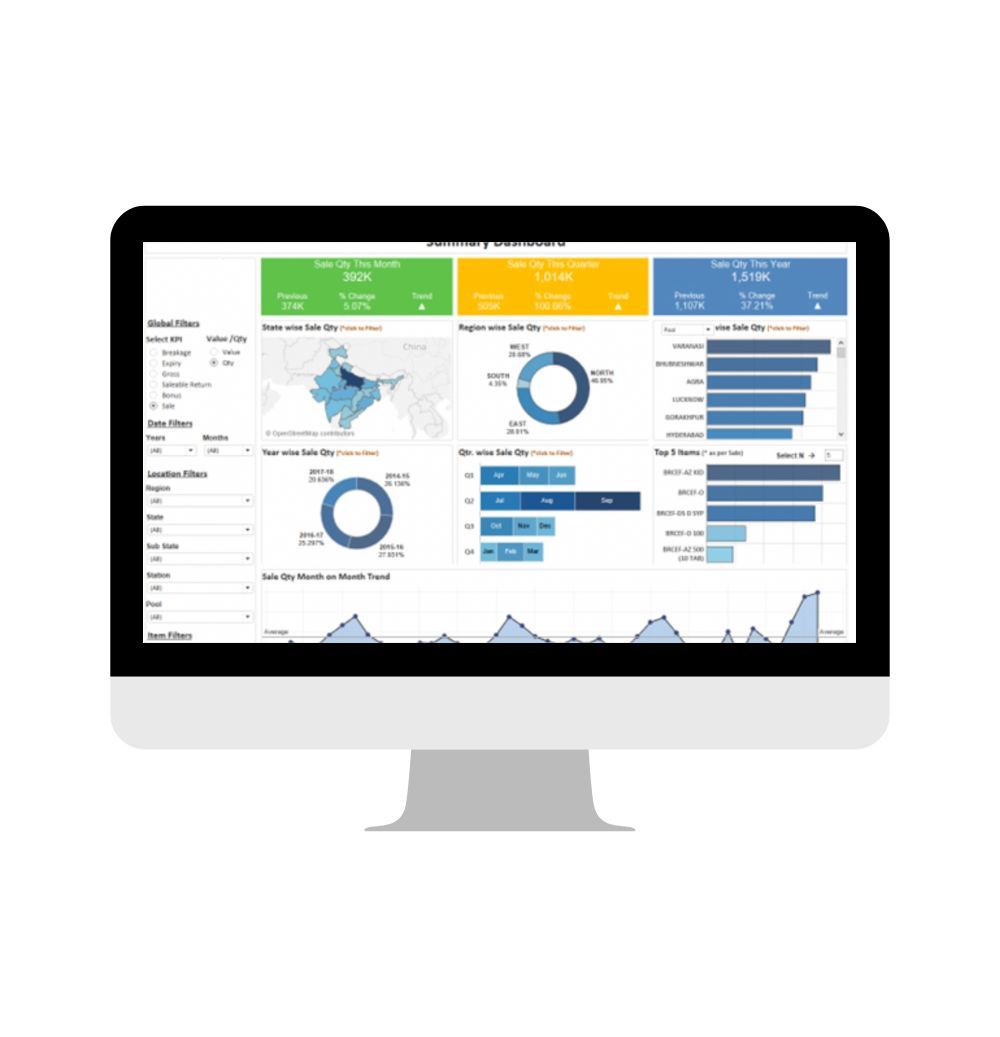
We use advanced software and tools to help you transform your manual excel reports into beautiful interactive dashboards you can download and share with the click of a button!
Our expert team will work closely with you to identify your specific reporting requirements and develop interactive dashboards tailored to your needs, saving you valuable time and resources.
Make your data beautiful
Tired of spending hours creating a histogram? Are you running out of ideas on how to best present all your data?
We produce stunning visualisations and graphs to bring your data to life.
With our state-of-the-art visualization tools, we transform complex data sets into intuitive and visually compelling representations, enabling you to communicate your fund's value proposition effectively.
Whether you need interactive charts or stunning graphs for your presentations, we customize our solutions to suit your specific needs.
Get a user-friendly, all-rounder CRM
Our CRM solution provides a centralized platform for:
1. Managing investor interactions
2. Tracking KPIs
3. Facilitating seamless communication.
With a user-friendly interface and advanced features, you can effortlessly monitor your activities across multiple areas and platforms, automate your processes, and gain valuable insights through data analytics.
Let us handle the technical aspects while you focus on nurturing meaningful relationships!
Save valuable time and resources from data crunching and dedicate more time into value creating activities.
We identify patterns, trends, and correlations that can inform investment strategies, market positioning and investor engagement.
Manage your investor interactions, capture important details and follow-ups, and capitalise on valuable opportunities for growth.
Get in touch with us and let's identify your needs and how we can be of value to your future.