Rundit: A Leap into the Future of LP Reporting and VC Portfolio Management Automation
Introduction
Venture capital (VC) and private equity (PE) firms often face complex challenges in managing their portfolios, such as tracking the performance of multiple investments, staying updated with the latest financial data, and ensuring compliance with regulatory standards. For instance, a VC might struggle to efficiently monitor the growth metrics of a tech startup, while a PE investor may find it cumbersome to aggregate financial reports from various portfolio companies for quarterly reviews.
Add to the mix the differing and increasing reporting standards and requirements imposed by the Invest EU, where large institutional limited partners (LPs) like the European Investment Fund (EIF) adhere to.
When it comes to fundraising from institutional LPs, it’s no secret that securing investment is only one part of the struggle. Indeed, the next part also involves fun things like providing regular and compliant reporting with stringent LP reporting requirements. What if this technology could streamline your reporting processes, making it easier to comply with industry standards like Invest Europe Investor Reporting guidelines?
We can almost hear your financial analyst opening a champagne bottle.
This is where digitalisation, like advanced portfolio management and reporting platforms, comes to save the day.
Hence, Rundit, a portfolio management and LP reporting platform for VC firms. After having diligently tested it ourselves, we would like to bring you the highlights and lowlights of the platform, including insights from
a former LP from the EIF.
Overview of Rundit
Rundit emerges as a modern tech solution for investment management and reporting, addressing the specific needs of VC and PE investors. It offers a range of features designed to streamline and enhance the portfolio management and the LP reporting process.
Key Features of Rundit
Portfolio Monitoring
Rundit provides VCs with a comprehensive platform for tracking and analysing data related to their portfolio companies.
Portfolio Management
Rundit offers insights into capital allocation as well as investments in order to provide a single source of information on portfolio performance. With detailed dashboards and aggregated data it gives investors a way to make informed decisions across their funds and companies.
LP Reporting
Rundit's LP reporting feature streamlines the process, enabling the creation of digital, interactive reports that are easy to customise. Their tool consolidates key data like fund performance and GP fees into a single report while ensuring compliance with Invest Europe guidelines.
Ease of Data Collection and Analysis
All in all, Rundit’s biggest value-add lies in its capabilities to automate the collection, analysis, and comparison of financial and qualitative data, reducing the time and effort spent on manual data entry, report building, and data maintenance. Their platform not only allows for more efficient and accurate analysis of portfolio and fund-related data but also enables streamlined and organised reporting all in one place.
Experiencing the Rundit Platform: The User Journey
Now for the nitty gritty.
Let’s start with the super helpful features that Rundit offers to VC funds.
Rundit’s Portfolio Management, Monitoring & Reporting Features
First, once you land on the first page, you’re greeted with three main sections as menu items at the top: The App, Companies, and Edit. Let’s examine them all.
The Main Platform: The APP Section
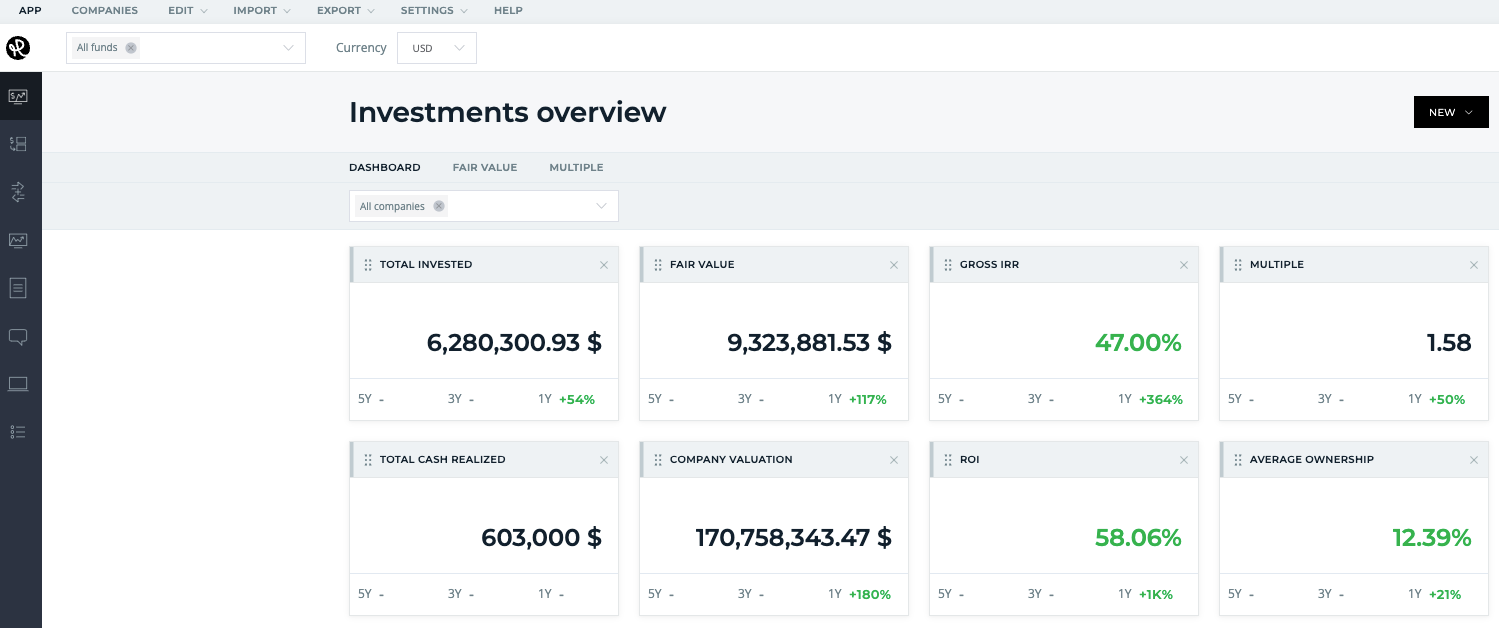
The App section is basically the platform and the interface offered by Rundit. Here, Rundit greets with its clear, visually appealing graphs that concisely display the entire portfolio on a single page. It's particularly useful for its ability to simplify complex investment data, making it easy for users to track where funds are allocated and see various types of breakdowns. Rundit literally offers one single database for all portfolio companies, providing a unified view of investments, metrics, and transactions. This is a massive advantage, especially for an active fund ramping up its investments.
Another point is the well-selected dashboard analytics, including a general overview and views on capital allocation, investments, and portfolio performance. All this adds to the user experience. A notable feature is a capability to compare and contrast different funds with each other or analyse portfolios individually.
Individual Dashboards
Now, let’s look at the individual dashboards and functionalities Rundit offers in its app. Each dashboard is tailored to provide specific insights and functionalities, enhancing the overall portfolio management and reporting process.
Capital Allocation
Integrates both quantitative as well as some qualitative data points like diversity, providing a richer analysis beyond just financial metrics. The breakdowns offered provide a quick way of seeing when and at which geography the capital is allocated per portfolio company, industry, stage, etc.
Investments
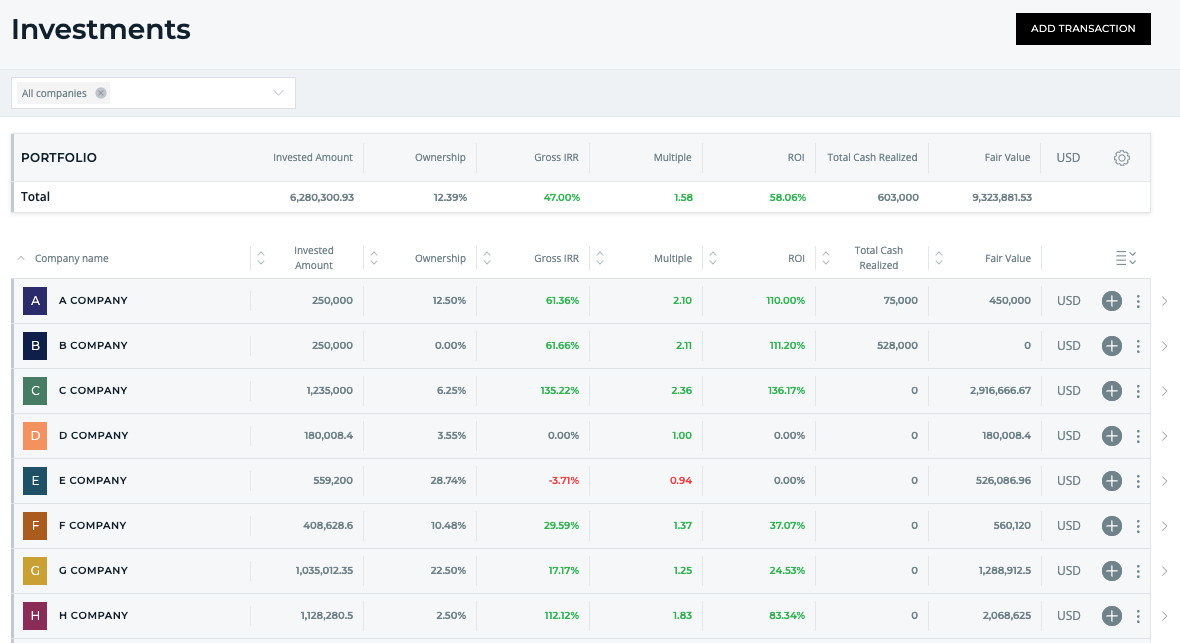
Rundit lets users see all the investee companies in one place, along with some financial data, which is the point of this section. We especially like the fact that it’s super easy to edit and update related transactional data as well as to view the company profile (more information on this below) directly from this interface.
Another helpful feature is the ability to filter in and out various companies and track aggregates accordingly.
Portfolio Performance
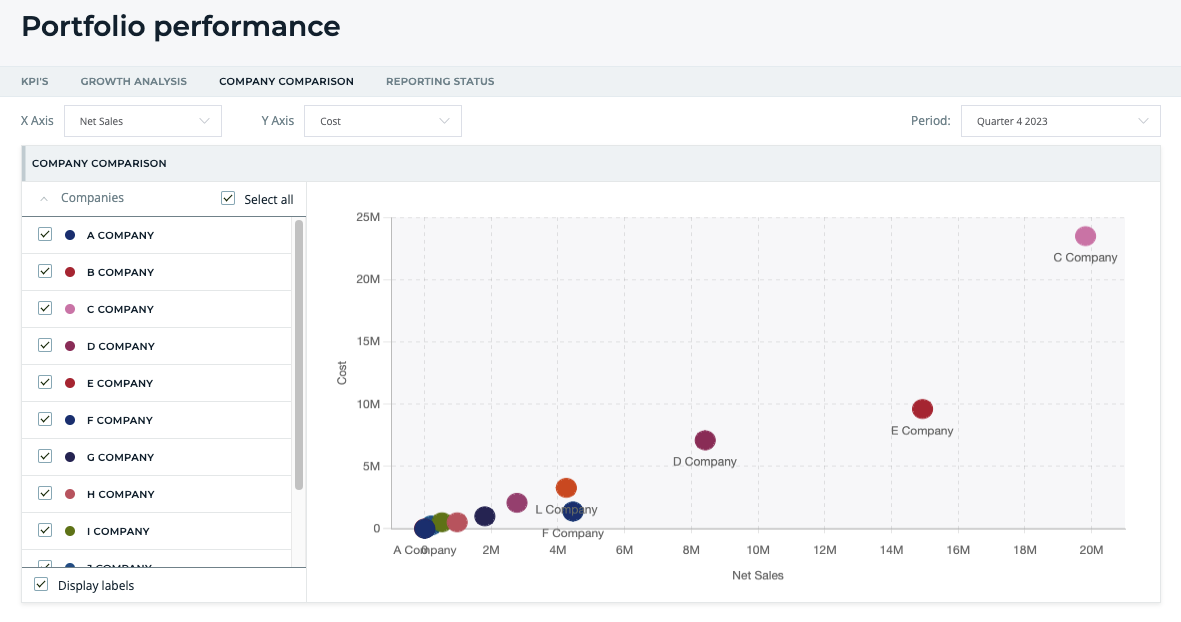
This part is one of the standout features that Rundit offers, complete with a table on KPIs, including the essential financial metrics like sales, cost, profit, and cash flow, as well as visuals for growth analysis and company comparisons. An added UX point is the customisable x and y axes to perform numerous analyses.
This section also tracks the submission of quarterly reports from portfolio companies and enables the user to send and customise reminder emails. Admittedly, it is a cool feature where you can compose, schedule, and send bulk emails to your companies.
Company Reports
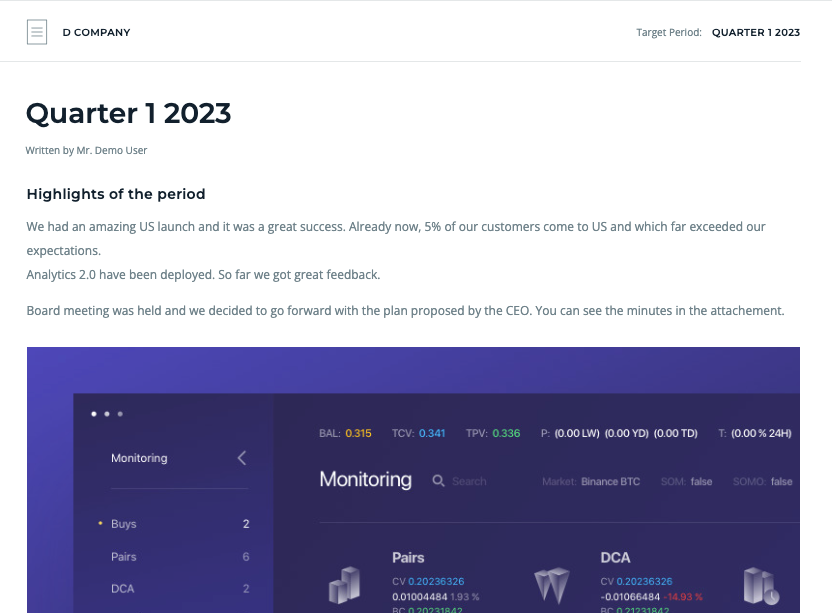
Rundit also enables the collection and archiving of reports sent by portfolio companies, which is essential for smooth portfolio monitoring. The report interface is rather digestible, listing highlights, comments, changes, and points where the company might need help.
Thinking out loud here, but if we were founders, we would be pretty happy if our investor conveniently had a platform where our reporting could be automated and stored.
Comments
Rundit also lets users keep a record of all comments associated with their portfolio companies, which is a thoughtful feature that acts like an internal communication mechanism between the various users of a VC firm, as well as enabling a smooth information flow about the companies in the portfolio.
Interactive LP Reports
This one is our all-time favorite and easily one of the best features of Rundit. This is where you can create interactive, customizable LP reports with beautiful and slick modifiable designs to be sent directly to the LPs. These reports include a variety of sections like fund basic information, portfolio summaries, information on fees, performance charts, as well as information on each portfolio company.
It’s like you have your own landing page along with menu items that act as an interactive table of contents dedicated to your report. It’s really the digital age here.
Here is a quick video of what an LP report could look like using Rundit's platform:
The Portfolio Company Database: The COMPANIES Section
The companies section in Rundit serves as a comprehensive database for portfolio company information. It offers high-level insights into each company, as well as giving the user the option to see the full company profile. This is where all the related data pertaining to a portfolio company lives.
Company profile
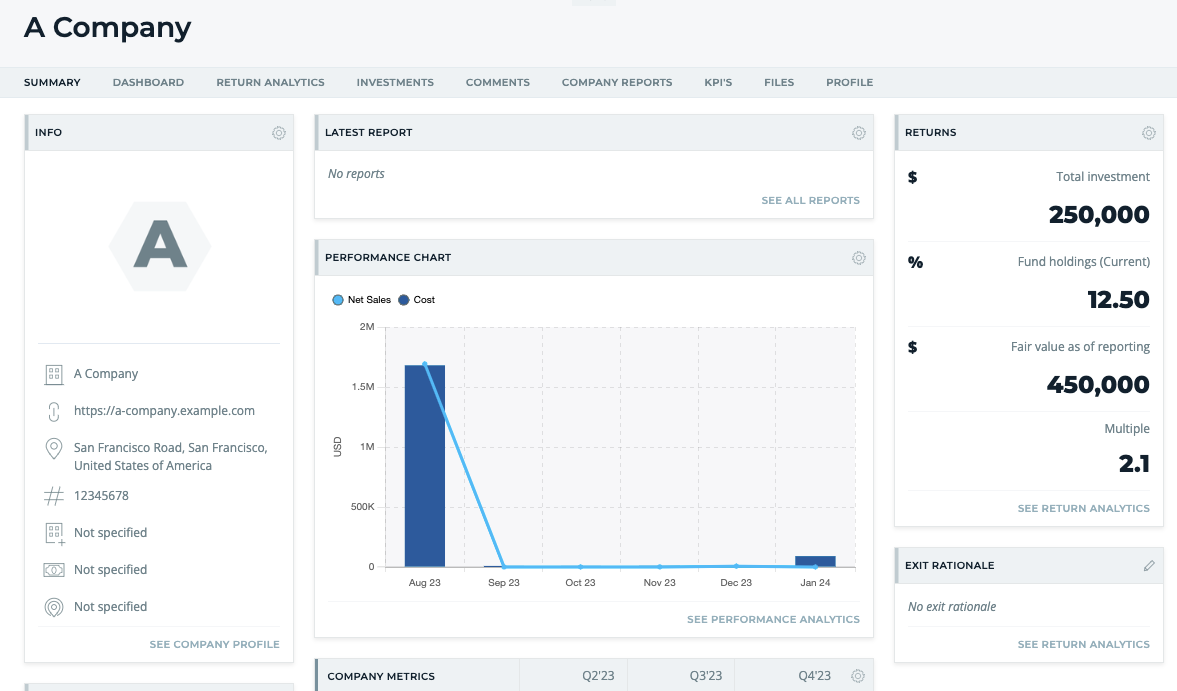
The company profile is essentially the bread and butter of the portfolio database. This page includes all information related to the company divided into various sections that show basic info, reports, performance and return analytics, KPIs, transaction history, related comments as well as any documents/files belonging to the company.
A standout feature is an ability to track and analyse KPIs, with options to add new metrics, including both quantitative and qualitative data points such as gender or impact-based variables (more and more relevant in 2024). Rundit also offers the flexibility to add custom metrics to have more control over what’s being measured.
Editing Data and Reports: The EDIT Section
This section is where Rundit lets you edit and update the individual data points you have on your fund, metrics, variables like sectors, edit/add companies, as well as founder and management teams. This is also where you can modify reporting templates for your portfolio companies.
Here, the ability to create different variables (called labels on the platform) allows you to tailor different analyses related to your portfolio as well as have them included in the dashboards.
Rundit, with its minimalistic, no-frills interface, makes it super easy to edit information and add fund or company-level records. The metrics and the data points analysed in its various dashboards and reports make up a solid reporting basis that complies with the minimum information requirements of institutional LPs.
Other Useful Features
Some other features that really enhance the user-friendliness of Rundit’s platform are the ability to import and export data easily as well as manage user permissions.
In this sense, Rundit lets you import a bunch of data related to metrics and company information, along with instructions for the correct configurations in order to prepare the system for additional data points.
Similarly, the tool lets you export all kinds of data related to your fund or companies in an Excel format, as well as some charts that could be used for presentations or other reporting documents.
Adding users and adjusting their access rights are also pretty straightforward. You can add users to the platform by invitation and administer which fund data they have access to.
What Would Make Rundit Even Better: Some Points to Improve
Rundit is a great choice for those fund managers who want to digitalise their reporting, automate their analytics, and streamline their portfolio management activities. And for all these, Rundit offers relevant tech-based solutions.
However, there remain a few points that we think would enhance the general usability of the platform.
Visualisations
Overall, Rundit could benefit from more visualisation choices (beyond the standard pie, bar, and line charts) as well as customizable visuals, allowing users to tailor the data representation to their specific needs. Pie charts, for example, could be beneficial to visualise data related to a small fund portfolio, but different charts would be necessary for bigger funds that oversee 30-40 investments.
The dashboards are great and clearly well thought out; however, we found ourselves wishing for a legend when trying to map different colors to related variables. Information on hover (like a tooltip) is already a welcome functionality and a legend would complete the chart UX.
ESG Metrics
In general, adding more integrated qualitative metrics like those related to ESG (environmental, social, and governmental) variables would provide a richer analysis.
Currently, Rundit gives the user the functionality to add or upload these custom metrics manually, but having them built-in would be a step in the right direction. Considering that big institutional LPs like the EIF have recently pivoted towards more thematic and ESG-based investment strategies, embracing the shift towards more impact-based reporting would certainly benefit Rundit.
Table Characteristics
While navigating the many table views, we felt slightly restricted by the fact that for the majority of the tables (i.e., in the Investments and Portfolio Performance sections) we could not add more variables nor modify the columns. In this sense, more flexibility over column sizes, and column orders, as well as modifying the aggregation of totals (e.g., to average, median, max, min), would provide more control over the data analysed in tables.
Custom Variables
Rundit makes data collection and editing easy. However, the platform could benefit from enabling the users to create custom calculations and add them as variables. Currently, custom fields can be added; however, the calculations need to be done out of the platform.
Export Formats
It’s great that Rundit enables the exporting of almost all portfolio and fund-related data to be used in different Excel reports. However, expanding export options beyond Excel to formats like PDF, HTML, JPG, etc., would cater to a wider range of user preferences.
Customer Service
A note on the team here. We actually spoke with Rundit on all the above and understand that they are currently working on relevant solutions as well as additional enhancements.
Overall, we were impressed by the feedback culture and the team’s general receptiveness to our proposals.
Pricing
Now, here's a very important question: How much exactly does Rundit cost?
The platform is free to use for VCs when invited by their investors. The same scheme applies to the portfolio companies upon invitation from their VCs. This is a major selling point and a great way to increase the user base.
Rundit also has a Lite version to which every fund manager can have access. However, as a GP, you can still contact the friendly sales team to see if you can test their platform for free.
For the remaining tiers, the pricing currently depends on the individual characteristics of a given VC, and the sales team is working on a pricing scheme.
Verdict: To Rundit or Not to Rundit?
After exploring Rundit's features, it's clear that this platform is well-suited for VC and PE firms seeking a more efficient and comprehensive way to manage their portfolios. While Rundit excels in areas like portfolio monitoring, investor reporting, and data analysis, it could enhance its offering with more diverse visualisations, expanded qualitative metrics, and greater flexibility in data handling.
We believe that Rundit offers a very promising solution, especially for those managers ready to make the next leap to digitalisation in reporting and portfolio management. Features like interactive dashboards, subtle animations and a sleek, interactive LP report in a scrollable landing page format demonstrate that Rundit has figured out the next generation of reporting and is only getting better.
On top of it, the fact that the platform becomes accessible to portfolio companies whose VCs subscribe to its features or to VCs whose LPs are paid users makes the value proposition even more compelling. In fact, we believe that this could even be a good incentive for a company to select digitally capable investors that use streamlined and automated solutions like Rundit over those that remain resource-intensive and manual process-heavy.
Are you ready for the future of portfolio reporting?
Ready to experience Rundit on your own? Or have more questions?
Why not book a quick call with their helpful team and get started on a free trial account?
Share this!


